Forecast Key Business Metrics with AWS Forecast
To run a successful business, you should be ready for the future. No matter the scale of the business, you should be ready for any circumstance. Almost all companies have been facing the problem of predicting its sales revenue, inventory management, workforce and resource management, financial planning, supply chain, healthcare, etc.
Before machine learning, people could only predict based on their experiences. But obviously, that cannot be precise. Since all the companies have been storing all these transactions (sales figures, inventory data) for a long time, this can be used to forecast the future using machine learning.
A good forecaster is not smarter than everyone else. He merely has his ignorance better organized. This Amazon Forecast example will utilize the AutoML algorithm.
Amazon Forecast is a fully managed service that uses machine learning to deliver highly accurate forecasts. It can achieve forecasting accuracy levels that used to take months of engineering in as little as a few hours with no machine learning experience to get started.
Amazon Forecast has helped succeed customers like CasaOne, CJ Logistics, OMOTOR, etc. https://aws.amazon.com/forecast/customers/
- Create Dataset and Import data
- Train a Predictor
- Generate Forecasts
Predicting the sales of an item for the next 10 days based on past sales records for 30 months.
To Start Forecasting your data, Upload it to an S3 Bucket.
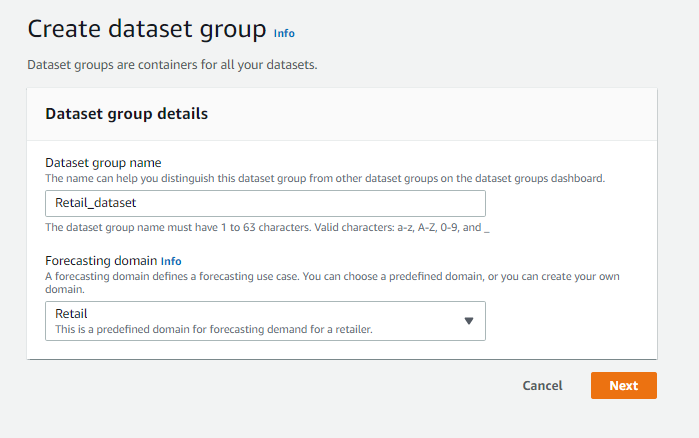
Open Amazon Forecast console and select “Create Dataset Group”.
To create a dataset group, there are 3 more steps:
- Create Dataset Group
- Create Target Time Series Dataset
- Import Target Time Series Data
Create Dataset Group:
You can give any Dataset Group Name and since our dataset is of forecasting retail we have selected Domain as “Retail”.

Amazon Forecast supports the following dataset domains:
Create Target Time Series Dataset:
In this step, you have to describe the Data scheme and the Frequency of your data needs to be given to Amazon Forecast.

Import Target Time Series Data:
In this step, Give the timestamp format of your dataset. It has to be a form of “yyyy-MM-dd” or “yyyy-MM-dd HH:mm:ss”.
You can create a new IAM role or select an existing role.
In the Data Location field, enter the path of your dataset present in S3.

To complete your first step, click on “Start Import” and wait for the import to complete.
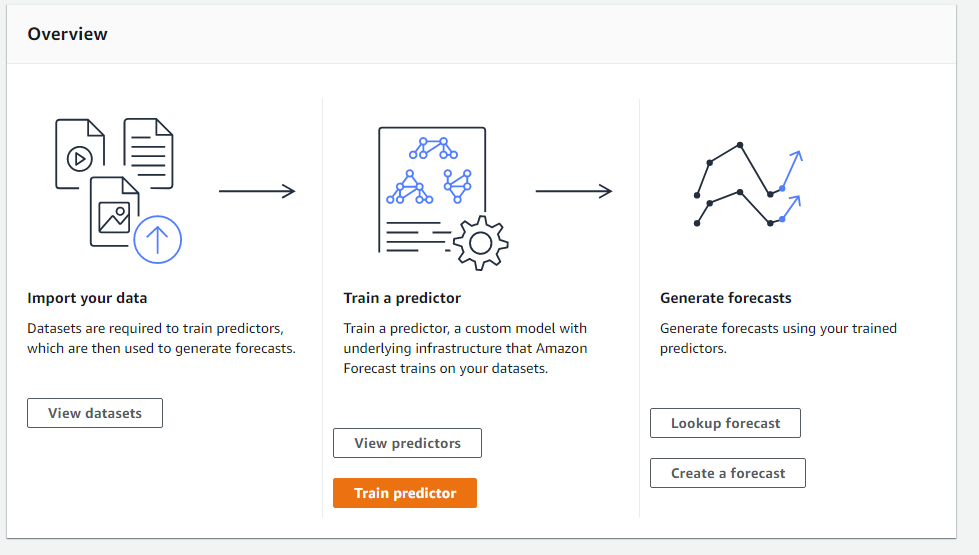
After the import is done, you would see a screen as shown below. Click on the “Start” button beside “Predictor Training”.

In this step, we will forecast for the next 10 days. So we’ve set the Forecast horizon as 10. For the “Algorithm Selection” you can select a manual algorithm or select “AutoML”. The rest of the things can be kept as default and click “Train Predictor”.
Amazon Forecast will now start to train the forecasting model by understanding the data and forming an algorithm that fits best for the provided dataset. It might take around 10–20 minutes depending on the size of your dataset.

After training your dataset, It’s finally time to generate the forecast and have a look into the future!!

After the training, you would see the above screen. Click on the “Start” button right next to “Forecast Generation”.
Here you can enter any name for your forecast and select the Training model that we have just trained.

Once that is done. It’s time to now forecast sales.
Click on “Lookup Forecast” as seen below.

Here you would be asked for the select your forecaster. Select a start date and end date. Remember, That the difference between the start and end date should not be greater than the “Forecast Horizon” that you had mentioned while training your model.
Since in our data we had only one item. We had to put the item_id as 1. Now hit “Get Forecast” and scroll down to see the results.

You would see something the result as mentioned below. The results have Time on the X-axis and the expected sales on the Y-axis.

The result does look confusing as to what is P10, P50 and P90 forecasts. These are the Prediction quantiles. By calculating prediction quantiles, the model shows how much uncertainty is associated with each forecast.
For the P10 prediction, the true value is expected to be lower than the predicted value, 10% of the time. For the P50 prediction, the true value is expected to be lower than the predicted value, 50% of the time. For the P90 prediction, the true value is expected to be lower than the predicted value, 90% of the time.
If you think you might face a problem of storage space or cost of investment if you overstock the item, you might wanna choose the P10 forecast. as you will be overstock for only 10% of the time else you would be sold out every day.
But on the other hand, the cost of not selling the item is extremely high or the cost of invested capital is low or it would result in huge amounts of lost revenue you might wanna choose the P90 forecast.
We have imported the data to an S3 bucket and uploaded them to the Forecast dataset. Trained the model using the AutoML predictor and used that to generate a forecast. You have successfully built your first “Time Series Forecasting” model, using Amazon Forecast.
"tutorial" - Google News
November 07, 2019 at 04:50AM
https://ift.tt/2PRuCoT
Amazon Forecast Tutorial : How to Forecast Business Metrics - idk.dev
"tutorial" - Google News
https://ift.tt/2N1vmVJ
Shoes Man Tutorial
Pos News Update
Meme Update
Korean Entertainment News
Japan News Update
No comments:
Post a Comment